Profits of China's major industrial firms sustained growth momentum in the first half of the year as production continued to recover.
Industrial firms each with annual main business revenue of at least 20 million yuan (about 2.95 million U.S. dollars) saw their combined profits exceed 4.27 trillion yuan in the period, the National Bureau of Statistics (NBS) said on Wednesday.
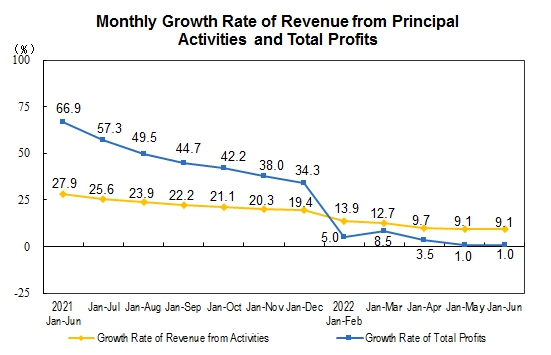
The figure represented a 1-percent year-on-year increase compared with the same period in 2021.
The combined revenues of those firms went up 9.1 percent from a year ago to 65.41 trillion yuan.
At the end of June, their assets totaled 148.66 trillion yuan, up 10.2 percent year on year, while their liabilities reached 84.58 trillion yuan, up 10.5 percent. The ratio of liabilities to assets stood at 56.9 percent, up 0.1 percentage points from a year ago.
In June alone, profits of major industrial companies went up 0.8 percent year on year, reversing declines in April and May, the data showed.
Zhu Hong, a senior statistician with the NBS, attributed the recovery to effective coordination of epidemic containment and economic and social development, as well as the thorough implementation of a raft of policies and measures to stabilize the economy.
Breaking down the data, Zhu highlighted the improvement in the business profit structure in June.
The profits of the equipment manufacturing industry increased 4.1 percent last month, up from a 9-percent decline registered in May, thanks to the continued recovery of industrial and supply chains.
Automobile manufacturers reported a sharp profit increase of 47.7 percent in June, as major automobile manufacturing areas including Shanghai and Jilin sped up work and production resumption.
Profits of consumer goods manufacturers declined 11.7 percent year on year last month, narrowing 6.7 percentage points from that in May.
Despite positive changes, Zhu cautioned against a complex external environment, noting that costs for the enterprises continue to rise and some companies still face difficulties in production and operation.
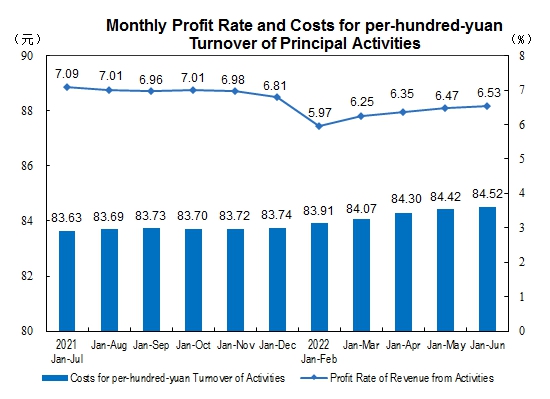
In the January-June period, the cost per 100 yuan of industrial revenue was 84.52 yuan, 0.84 yuan higher than a year ago.
Efforts should be made to continue to expand effective investment, boost consumer demand, expand tax and fee cuts and strengthen support for enterprises to create more favorable conditions for the sustained and steady recovery of the industrial economy, said Zhu.
_____________________________________________________
The Profit of Industrial Enterprises above Designated Size from January to June in 2022
National Bureau of Statistics of China 2022-07-28
From January to June, industrial enterprises above designated size nationwide achieved a total profit of 4,270.22 billion yuan, an increase of 1.0 percent year-on-year (calculated on a comparable basis, see note II for details).
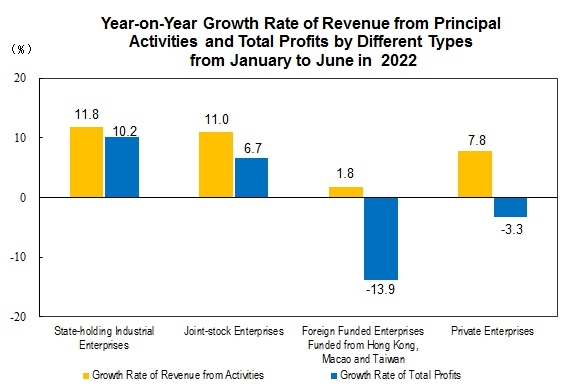
From January to June, among industrial enterprises above designated size, state-owned holding enterprises achieved a total profit of 1,489.45 billion yuan, an increase of 10.2 percent year-on-year; joint stock enterprises achieved a total profit of 3,197.79 billion yuan, an increase of 6.7 percent; the total profit of foreign-invested enterprises and enterprises with investment from Hong Kong, Macao and Taiwan was 981.41 billion yuan, a decrease of 13.9 percent; and private enterprises achieved a total profit of 1,188.57 billion yuan, down 3.3 percent.
From January to June, the mining industry achieved a total profit of 852.82 billion yuan, a year-on-year increase of 1.20 times; the total profit of manufacturing industry was 3,189.31 billion yuan, down 10.4 percent; and the total profit of power, heat, gas and water production and supply industry was 228.09 billion yuan, down 18.1 percent.
From January to June, among the 41 major industrial sectors, the total profits of 16 industries increased year-on-year and 25 industries decreased. The profits of major industries were as follows: the total profits of coal mining and washing industry increased by 1.57 times year-on-year, the oil and natural gas mining industry increased by 1.26 times, the electrical machinery and equipment manufacturing industry increased by 17.3 percent, the non-ferrous metal smelting and processing industry increased by 16.6 percent, the chemical raw materials and chemical products manufacturing industry increased by 16.4 percent, the special equipment manufacturing industry decreased by 3.2 percent, the textile industry decreased by 5.3 percent, the non-metallic mineral products industry decreased by 5.8 percent, the manufacturing of computers, communication and other electronic equipment fell by 6.6 percent, the processing of agricultural and sideline food fell by 6.8 percent, the manufacturing of general equipment fell by 15.9 percent, the production and supply of electricity and heat fell by 19.3 percent, the automobile manufacturing fell by 25.5 percent, the processing of oil, coal and other fuels fell by 32.4 percent, and the smelting and processing of ferrous metals fell by 68.7 percent.
From January to June, industrial enterprises above designated size achieved an operating income of 65.41 trillion yuan, an increase of 9.1 percent year-on-year; the operating costs incurred were 55.29 trillion yuan, an increase of 10.2 percent; and the profit margin of operating revenue was 6.53 percent, a year-on-year decrease of 0.52 percentage point.
At the end of June, the assets of industrial enterprises above designated size totaled 148.66 trillion yuan, an increase of 10.2 percent year-on-year; liabilities totaled 84.58 trillion yuan, an increase of 10.5 percent; the owner's equity totaled 64.08 trillion yuan, an increase of 9.9 percent; and the asset liability ratio was 56.9 percent, an increase of 0.1 percentage point year-on-year.
At the end of June, the accounts receivable of industrial enterprises above designated size were 20.19 trillion yuan, an increase of 13.6 percent year-on-year; and the inventory of finished products was 5.93 trillion yuan, an increase of 18.9 percent.
From January to June, the cost per hundred yuan of operating income of industrial enterprises above designated size was 84.52 yuan, an increase of 0.84 yuan year-on-year; and the expense per 100 yuan of operating income was 7.95 yuan, a year-on-year decrease of 0.52 yuan.
At the end of June, the operating income of industrial enterprises above designated size per 100 yuan of assets was 89.9 yuan, a year-on-year decrease of 1.0 yuan; the per capita operating income was 1.746 million yuan, an increase of 152,000 yuan year-on-year; the inventory turnover days of finished products were 18.4 days, an increase of 1.2 days year-on-year; and the average payback period of accounts receivable was 53.7 days, an increase of 2.4 days year-on-year.
|
Key Financial Indicators of Industrial Enterprises above the Designated Size from January to June (Group by Industries)
|
||||||
|
Table III |
||||||
|
Indicators |
Operating Income |
Operating Costs |
Total Profits |
|||
|
Jan-Jun (100 million yuan) |
Increase rate Y/Y (%) |
Jan-Jun (100 million yuan) |
Increase rate Y/Y (%) |
Jan-Jun (100 million yuan) |
Increase rate Y/Y (%) |
|
|
|
|
|
|
|
|
|
|
Total |
654147.3 |
9.1 |
552871.1 |
10.2 |
42702.2 |
1.0 |
|
Mining and Washing of Coal |
20182.2 |
57.1 |
11986.1 |
39.1 |
5369.1 |
157.1 |
|
Extraction of Petroleum and Natural Gas |
6229.9 |
49.6 |
2850.2 |
11.3 |
2165.6 |
126.0 |
|
Mining of Ferrous Metal Ores |
2580.5 |
-12.8 |
2006.5 |
-7.5 |
406.4 |
-4.0 |
|
Mining of Non-Ferrous Metal Ores |
1685.4 |
22.1 |
1115.8 |
17.2 |
372.8 |
59.1 |
|
Mining And Processing of Nonmetal Ores |
2024.5 |
5.6 |
1496.9 |
4.1 |
202.4 |
17.9 |
|
Mining Support Service Activities |
985.4 |
10.2 |
936.4 |
10.1 |
11.6 |
300.0 |
|
Mining of Other Ores N.E.C |
10.1 |
62.9 |
9.4 |
84.3 |
0.4 |
33.3 |
|
Processing of Food From Agricultural Products |
26468.3 |
3.9 |
24353.3 |
4.7 |
796.9 |
-6.8 |
|
Manufacture of Foods |
10704.5 |
6.4 |
8498.8 |
7.4 |
845.5 |
8.3 |
|
Manufacture of Wines, Beverage and Refined Tea |
8565.6 |
7.4 |
5730.4 |
4.8 |
1822.5 |
21.0 |
|
Manufacture of Cigarettes And Tobacco |
7391.5 |
7.4 |
2128.6 |
6.0 |
1067.7 |
6.7 |
|
Manufacture of Textile |
12489.8 |
4.7 |
11164.7 |
5.2 |
426.3 |
-5.3 |
|
Manufacture of Textile Wearing Apparel And Ornament |
6884.8 |
4.5 |
5922.8 |
5.3 |
307.3 |
4.0 |
|
Manufacture of Leather, Fur, Feather Aad Its Products |
5511.2 |
6.5 |
4791.6 |
6.8 |
249.7 |
-0.8 |
|
Processing of Timbers, Manufacture of Wood, Bamboo, Rattan, Palm, and Straw Products |
4746.4 |
3.1 |
4299.2 |
3.2 |
155.2 |
-4.9 |
|
Manufacture of Furniture |
3604.0 |
-4.0 |
3023.2 |
-4.0 |
174.8 |
2.6 |
|
Manufacture of Paper and Paper Products |
7374.6 |
2.5 |
6499.4 |
6.2 |
259.9 |
-46.2 |
|
Printing, Reproduction of Recording Media |
3510.1 |
1.1 |
2978.7 |
1.5 |
169.1 |
-7.2 |
|
Manufacture of Articles for Culture, Education, Artwork, Sport and Entertainment Activity |
6963.7 |
4.0 |
6051.7 |
3.9 |
312.3 |
6.6 |
|
Petroleum, coal and other Fuel Manufacturing |
31885.1 |
23.6 |
26943.2 |
29.5 |
1182.8 |
-32.4 |
|
Manufacture of Chemical Raw Material and Chemical Products |
45950.3 |
19.9 |
38099.6 |
22.1 |
4387.4 |
16.4 |
|
Manufacture of Medicines |
14007.8 |
-0.6 |
8159.6 |
10.3 |
2209.5 |
-27.6 |
|
Manufacture of Chemical Fibres |
5367.2 |
10.6 |
4965.7 |
16.3 |
163.9 |
-51.2 |
|
Manufacture of Rubber and Plastics Products |
14189.2 |
1.4 |
12153.3 |
3.1 |
659.0 |
-20.4 |
|
Manufacture of Non-Metallic Mineral Products |
31708.4 |
3.1 |
26626.5 |
4.3 |
2269.2 |
-5.8 |
|
Manufacture and Processing of Ferrous Metals |
45759.7 |
-3.6 |
43326.5 |
0.7 |
826.1 |
-68.7 |
|
Manufacture and Processing of Non-Ferrous Metals |
38035.5 |
18.4 |
35217.2 |
19.1 |
1601.6 |
16.6 |
|
Manufacture of Fabricated Metal Products |
22798.5 |
5.0 |
20219.4 |
5.7 |
831.5 |
-8.4 |
|
Manufacture of General-Purpose Machinery |
22317.6 |
-3.7 |
18538.8 |
-3.0 |
1320.0 |
-15.9 |
|
Manufacture of Special-Purpose Machinery |
17336.8 |
0.9 |
13761.3 |
0.9 |
1300.1 |
-3.2 |
|
Manufacture of Motor Vehicles |
40892.8 |
-4.2 |
35431.2 |
-3.1 |
2129.0 |
-25.5 |
|
Manufacture of Railway Locomotives, Building of Ships and Boats, Manufacture of Air and Spacecrafts and Other Transportation Equipments |
5815.2 |
0.3 |
4986.2 |
0.8 |
272.8 |
-3.7 |
|
Manufacture of Electrical Machinery and Equipment |
46404.7 |
21.0 |
40167.9 |
22.3 |
2327.6 |
17.3 |
|
Manufacture of Computer, Communication Equipment and Other Electronic Equipment |
70198.9 |
7.7 |
61099.9 |
8.7 |
3233.8 |
-6.6 |
|
Manufacture of Measuring Instrument and Meter |
4162.7 |
3.4 |
3175.6 |
4.9 |
389.1 |
-2.8 |
|
Other Manufacturing |
1007.9 |
10.1 |
853.8 |
10.4 |
52.0 |
15.8 |
|
Waste Recycling and Recovery |
5272.4 |
29.0 |
5040.5 |
30.9 |
133.3 |
-0.8 |
|
Repair of Fabricated Metal Products, Machinery and Equipment |
682.1 |
1.9 |
591.1 |
5.1 |
17.0 |
-44.1 |
|
Production and Supply of Electric Power and Heat Power |
42875.0 |
16.9 |
39322.9 |
19.7 |
1686.9 |
-19.3 |
|
Production and Distribution of Gas |
7551.9 |
28.3 |
6835.0 |
33.5 |
416.6 |
-17.1 |
|
Production and Distribution of Water |
2015.0 |
8.5 |
1512.0 |
11.3 |
177.4 |
-7.5 |
Note: The total of some indicators in this table is not equal to the sum of sub items, which is caused by data rounding, without mechanical adjustment.